Smart Drones for
Fire-Fighting
Location
Boston, USA
Helpful Links:
Year
2021
-
Created a project plan for development of Smart Drones, with extensive focus on scope, schedule, and budget
-
Devised a profound Gantt chart using GanttProject, PERT chart, financial report, risk, and resource management in Excel/Lucid Charts/Visio
-
Presented the technical understandings through UML diagrams: State diagram, activity diagrams, component diagram
Work Break Down Structure (WBS)
It shows a complete breakdown of all the tasks to be achieved during the project to reach to the final goal.

SWOT Analysis
These depictions below show the risks involved in the project, thus as a project manager, I have a calculated plan to counter them and thereby handle the stakeholders.
Risk Matrix 3x3

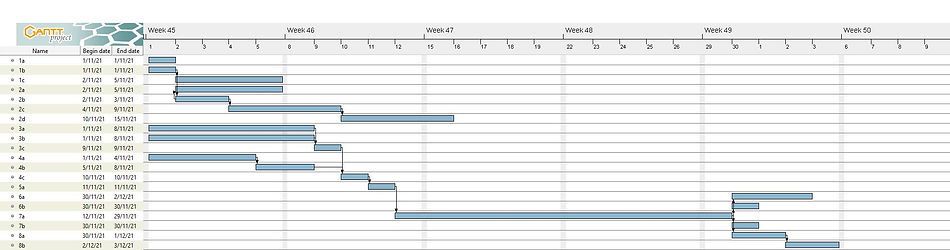
Gantt Chart
It gives out the timeline of the project. It is a reflection of the PERT chart but with respect to time. The maximum time is taken up by manufacturing, while a lot of work is being done during the first few months. Hence, that time is pressurized and time-intensive.
PERT Chart
It shows the tasks to be performed and how they interact with each other, ie. the dependencies of one task to another. In addition, the start date and the end dates have been given for each task to allow the project to have a smooth timeline.

